Portfolio Analysis View
Portfolio Analysis View:
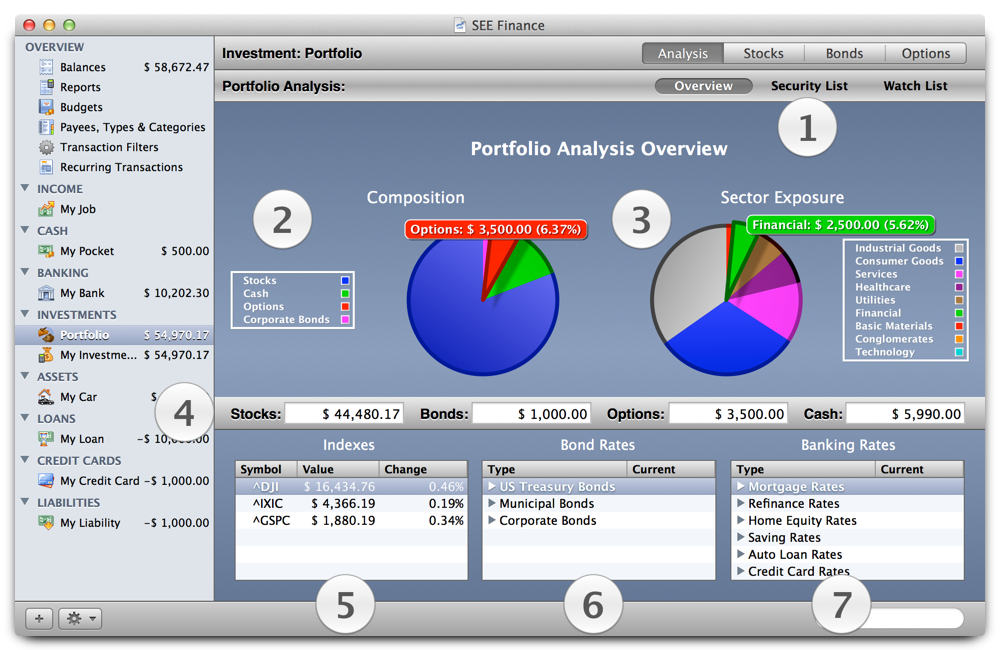
- The "1" marker is just below of buttons used to choose between the Portfolio Analysis View, the Security List View, and the Watch List View.
- The "2" marker is below the pie chart that shows the composition of your investment portfolio, based on stock, bonds, options, etc.
- The "3" marker is below the pie chart that shows the sector exposure of the stocks in your investment portfolio, based on the nine standard sectors ("Basic Materials", "Industrial Goods", "Services", "Consumer Goods", "Technology", "Conglomerates", "Financial", "Healthcare", and "Utilities").
- The "4" marker is to the left of the bar showing the value of all of your positions (Stocks, Bonds, Options, and Cash).
- The "5" marker is just below the table that lists all your watched stock indexes.
- The "6" marker is just below the table that lists common bond rates (for "U.S. Treasury", "Corporate" and "Municipal" bonds).
- The "7" marker is just below the table that lists common bank rates.
Notes:
- The amount listed for "Portfolio" in the Account List is the market value of your investment positions plus the cash value of all your investment accounts.
See also
Investment Account View
Investment Portfolio View
Portfolio Watch List View
Portfolio Security List View
Investments Stock Positions View
Investments Bond Positions View
Investments Option Positions View
List of View Topics