Investment Option Positions View
Investment Option Positions View:
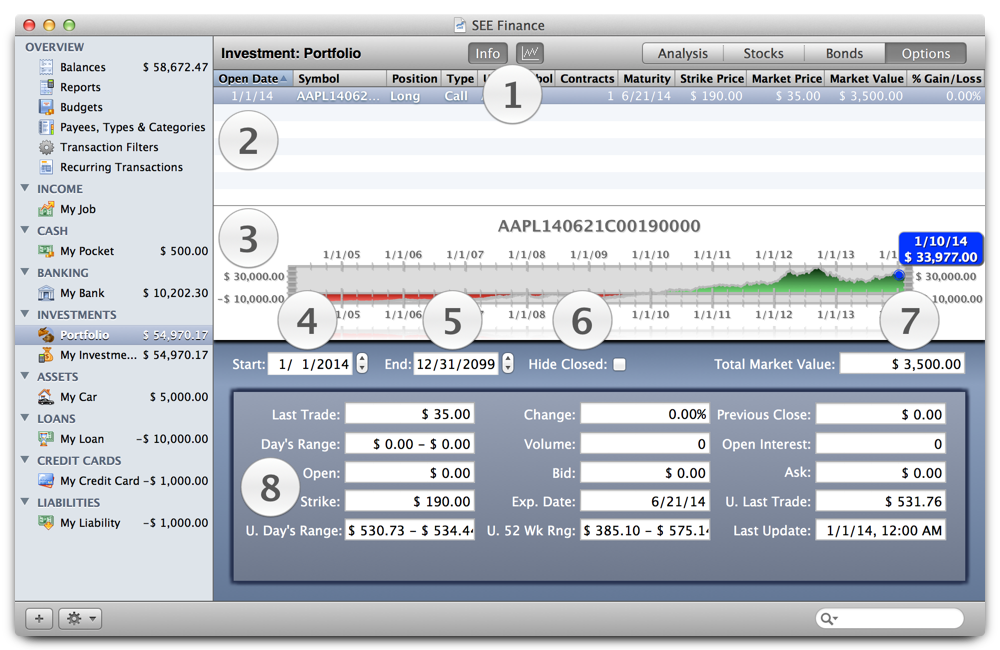
- The "1" marker is just below the "Info" and graph buttons that raises and lowers the option positions info view (see marker "8") and graph view.
- The "2" marker shows the location of the option positions table, which lists all the portfolio's option positions that are between the selected start and end dates and abide by the "Hide Closed" selection.
- The "3" marker shows the location of the option positions graph view. This graph shows the historical prices of the underlying security of the option selected in the option positions table. Control clicking ("Control + click") the graph allows you to select longer/shorter time intervals for the graph.
- The "4" marker is above the "Start" date picker, which lets you set the starting date for the positions shown in the positions table.
- The "5" marker is above the "End" date picker, which lets you set the ending date for the positions shown in the positions table.
- The "6" marker is above the "Hide Closed" date picker, which lets you hide closed positions in the positions table.
- The "7" marker is above the "Total Market Value" text field, which shows the total market value of all your option positions.
- The "8" marker shows the location of the option positions info view, which lists all kind of useful information about the selected option in the option positions table and it's underlying security.
Notes:
- In the position tables you can Control click the table to display the table's contextual menu with selections for setting the optional columns and column sorting.
See also
Investment Account View
Investment Portfolio View
Portfolio Analysis View
Portfolio Security List View
Portfolio Watch List View
Investments Stock Positions View
Investments Bond Positions View
List of View Topics